
Run PageSpeed Insights right now, then fix whatever it flags in this order: server response time, your largest image or headline text, then anything blocking the page from rendering. Turn on caching, compress your images, and ask your host about server response time. Most small-business sites that do just this see faster load times, fewer people bouncing before the page even appears, and a modest bump in search visibility within weeks.
TL;DR:
- Fix server response times to ensure TTFB stays under 200 milliseconds, as higher delays significantly slow down the overall page load.
- Prioritize optimizing the Largest Contentful Paint by compressing large images, using modern formats like WebP or AVIF, and avoiding lazy-loading above-the-fold images.
- Limit third-party scripts such as chat widgets and ad codes, and load them after the main content to prevent unpredictable slowdowns.
- Optimize custom fonts by using display swap, restricting font weights, and hosting fonts locally or through a CDN to reduce font-related delays.
- Conduct regular speed tests focusing on homepage, contact, and key service pages, balancing efforts between quick wins and more complex server or code optimizations.
Table of Contents
- What Website Speed Improvement Actually Means (And Why “Fast Enough” Isn’t a Feeling)
- How Do I Check My Website’s Speed?
- Quick Wins: What Can I Fix Today?
- What Should My Developer or Host Handle?
- How Do I Know Which Fix to Do First?
- How CloudSprout Approaches Website Speed Improvement
- Why Is My Site Slower With Chat Widgets and Ads Installed?
- Why Do Custom Fonts Slow Down My Website?
- Where Owner-Operators Should Actually Spend Their Time
- Get Your Free Speed and SEO Audit From CloudSprout
- Sources
- FAQ
What Website Speed Improvement Actually Means (And Why “Fast Enough” Isn’t a Feeling)
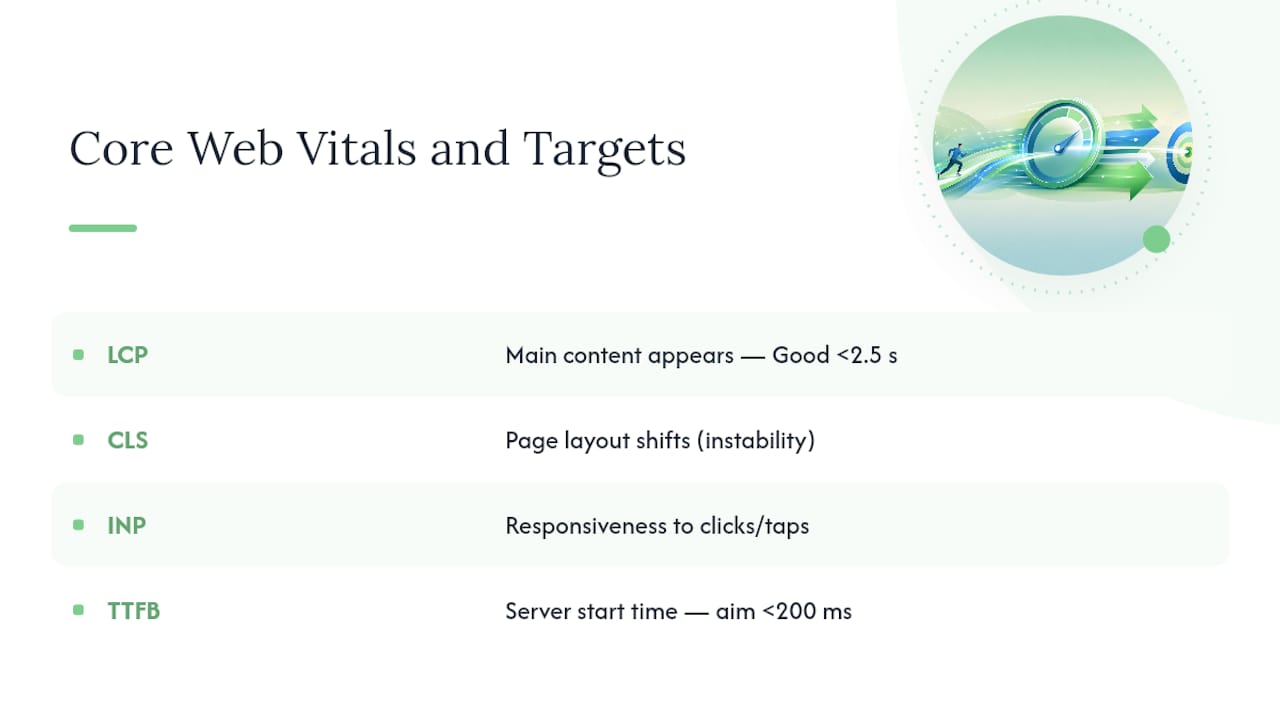
Website speed improvement means hitting specific, measurable targets, not just a page that “feels” quick on your office WiFi. Google groups these under Core Web Vitals, which measure three things: how fast the main content appears (Largest Contentful Paint, or LCP), whether the page jumps around while loading (Cumulative Layout Shift, or CLS), and how quickly it responds when someone clicks or taps (Interaction to Next Paint, or INP). A fourth metric, Time to First Byte (TTFB), measures how long your server takes to start sending data at all.
Google’s own thresholds say LCP under 2.5 seconds is “Good,” 2.5 to 4 seconds “Needs Improvement,” and anything past 4 seconds is “Poor.” For TTFB, aim under 200 milliseconds to keep the rest of the page loading on schedule.
Why this matters for a small business: a slow LCP doesn’t just annoy visitors, it can quietly hurt your search rankings, since Core Web Vitals are the industry-standard metrics Google uses to judge page experience. A plumbing company whose homepage takes 5 seconds to show its phone number is losing calls before the page even finishes loading.
How Do I Check My Website’s Speed?
You don’t need to guess. Four free tools cover almost every diagnostic need a small-business owner has, and each one tells you something slightly different.
- PageSpeed Insights runs Google’s Lighthouse engine and gives you both a lab score and, if your site has enough traffic, real visitor data pulled from the Chrome UX Report. Start here.
- WebPageTest shows a detailed waterfall chart, a visual timeline of every file your page loads and how long each one takes. This is where you actually see what’s slow, not just that something is.
- GTmetrix blends Lighthouse scoring with its own waterfall view and historical tracking, useful if you want to check your site weekly and watch trends over time.
- Chrome DevTools (built into Chrome, hit F12) lets you open the Network panel and watch requests load in real time, which is handy for catching a slow third-party script mid-load.
Here’s a simple first test: open PageSpeed Insights, paste in your homepage URL, and note three numbers, LCP, CLS, and TTFB. Then test your busiest service page and one contact or booking page, since those often load differently than the homepage. Save each report (screenshot or PDF) so you can compare before and after any changes.
One distinction matters: lab data (from PageSpeed Insights or GTmetrix) tests one simulated visit under controlled conditions. Field data (the real-user numbers PageSpeed Insights pulls from Chrome) shows what actual visitors experienced, on their actual phones and connections. Lab data tells you what to fix. Field data tells you whether the fix worked.
Quick Wins: What Can I Fix Today?
Some of the biggest speed gains cost nothing but an afternoon. These are the fixes to tackle first, roughly in order of impact versus effort.
- Compress and resize images. A photo straight off a phone camera can be 4 or 5 megabytes; resized and compressed for web, it’s often under 200 kilobytes with no visible quality loss.
- Switch to WebP or AVIF. Both reduce file size significantly compared to JPEG, with AVIF compressing best but WebP offering more reliable browser support as a default choice.
- Add width and height attributes to every image, and use srcset so phones load a smaller file than desktops. This stops the page from jumping around while images load, which is what actually causes a bad CLS score.
- Turn on browser caching so returning visitors don’t redownload your logo, stylesheet, and fonts on every visit.
- Minify your CSS and JavaScript (strip out extra spacing and comments) and defer anything that isn’t needed to render the visible part of the page.
- Audit your plugins and widgets. A booking widget, a chat bubble, and three marketing plugins can each add their own scripts, and most sites are running at least one nobody actually uses anymore.
- Lazy-load images below the fold, but never lazy-load the one image or headline that shows up first (your LCP element). Lazy-loading that one actually makes LCP worse, not better.
Pro Tip: If you’re briefing a developer or agency instead of doing this yourself, don’t just say “make it faster.” Hand them your PageSpeed Insights report and say: “Fix everything flagged red, starting with LCP and CLS.” That single sentence turns a vague request into a scoped task with a clear finish line.
What Should My Developer or Host Handle?
Some fixes need server access or hosting changes that go beyond what most owners should touch themselves. These are the conversations worth having with whoever manages your hosting.
- Server-side caching. Options range in complexity: Nginx FastCGI or Varnish deliver the biggest TTFB reductions but need server-level access, while WordPress plugins like caching plugins offer solid wins on shared hosting without touching the server config.
- Upgrade hosting if TTFB won’t drop below 200ms no matter what caching you add. Cheap shared hosting is often the actual bottleneck, not your code.
- Configure a CDN. A content delivery network caches your static files (images, CSS, fonts) on servers physically closer to your visitors, and typically shaves 0.5 to 1.5 seconds off LCP for visitors located far from your origin server, useful if you serve customers outside your immediate region.
- Enable Brotli or GZIP compression on your server, and move to HTTP/2 or HTTP/3 if you haven’t already; modern transports handle many small file requests far more efficiently than older HTTP/1.1 connections.
- Set long cache expiration times on static assets, paired with cache-busting file names so updates still show up immediately instead of getting stuck behind an old cached version.
- Inline critical CSS for above-the-fold content and split JavaScript into smaller chunks that load only when needed, rather than one giant file every page has to download upfront.
Ask any developer or agency one direct question: “What’s my current TTFB, and what will you do to get it under 200 milliseconds?” If they can’t answer that specifically, that’s worth noting.
How Do I Know Which Fix to Do First?
Open a waterfall report in WebPageTest or GTmetrix and look for three things: a long bar at the very top (slow TTFB, meaning your server itself is sluggish), oversized image files taking longer than everything else combined, and scripts marked “render blocking” that delay everything below them.
- Fix server response time first. If TTFB is over 200 milliseconds, nothing else matters much until that’s addressed, since every other resource waits on that first byte before it can even start loading.
- Fix your LCP element next. Find whatever image or text block is your largest visible content and make sure it loads fast and isn’t lazy-loaded.
- Compress and resize remaining images, then tackle any third-party scripts showing up as render-blocking in the waterfall.
- Save advanced JavaScript work for last, since code-splitting and critical CSS inlining take longer to implement and usually deliver smaller gains than the first three steps.
Expect caching and hosting fixes to take a developer a day or two and deliver the biggest jump. Image and script cleanup is often a half-day of work with visible results. Advanced code splitting can take a week and matters most for sites with heavy JavaScript, think booking systems or interactive tools, not a five-page brochure site.
How CloudSprout Approaches Website Speed Improvement
Some agencies start every speed engagement with a free audit that runs your site through a series of tools and returns a prioritized list of what to fix first, the anticipated developer time cost, and expected improvements. From there, fixes may be implemented in-house or outsourced, with monitoring afterward to ensure new plugins or scripts do not undo the work later.
If you’re comfortable running PageSpeed Insights yourself and handing a punch list to a developer, the quick wins above will get you most of the way there. If your site runs on shared hosting, has a builder full of plugins, or you just don’t have the hours to chase this down, that’s the gap an agency-built website or a full digital audit is meant to close.
Why Is My Site Slower With Chat Widgets and Ads Installed?
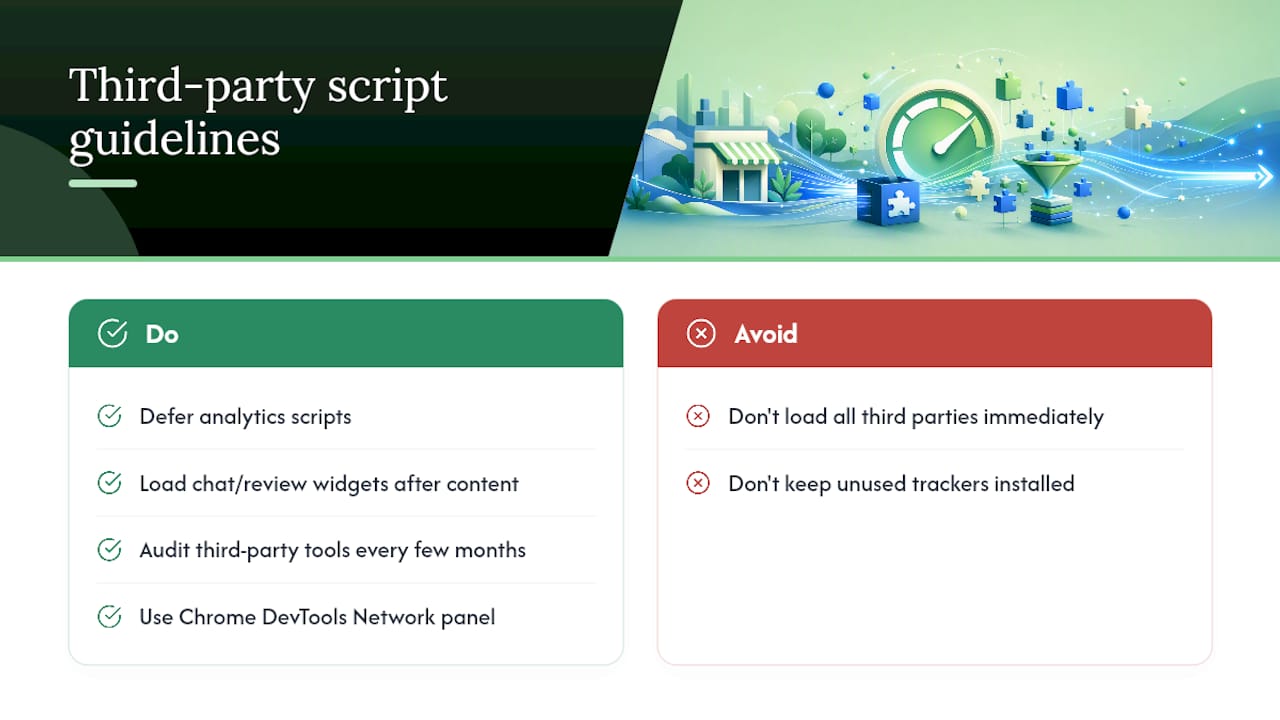
Third-party scripts, live chat widgets, analytics trackers, Facebook pixels, ad network code, are consistently among the largest sources of unpredictable performance problems on small-business websites. Each one loads from someone else’s server, on someone else’s schedule, and you have zero control over how fast that server responds.
A landscaping company might install a chat widget, a review-collection tool, a Facebook pixel, and a Google Ads conversion tag, each added separately, each seeming harmless alone. Loaded together, they can easily add a full second or more to load time, and none of them show up as “your” code when you’re looking at your own files.
Want this running in your business without doing it yourself?
Book a Free Consultation →The fix isn’t necessarily removing every third-party script. It’s being deliberate about which ones load immediately versus which can wait. Load chat widgets and review popups after the main content renders, not before. Defer analytics scripts so they don’t compete with your headline image for bandwidth. And audit these tools every few months, because it’s common for a business to have three tracking scripts installed when only one is actually being checked.
If your site uses a page builder or several marketing plugins, this is worth checking directly in Chrome DevTools’ Network panel: sort by load time and see which domains outside your own are taking the longest.
Why Do Custom Fonts Slow Down My Website?
Custom fonts look great in your brand guidelines and terrible for load time if they’re not handled carefully. A font file has to download before the browser can show text in it, and by default, many browsers hide that text entirely until the font arrives, a blank flash where your headline should be.
The fix is a CSS property called font-display: swap, which tells the browser to show text in a fallback font immediately, then swap to your custom font once it loads. This alone eliminates the invisible-text problem most small-business sites don’t even realize they have.
Beyond that: limit yourself to two font families and avoid loading six weights of each when you use two. Preload your primary heading and body fonts so the browser starts fetching them the moment the page begins loading rather than discovering them later in the CSS. And host fonts yourself or through a CDN rather than pulling from a third-party font service if you can, since that’s one less external server your page has to wait on.
A local bakery site using a decorative script font for headlines is a common example: gorgeous on brand, but if that font file is 300 kilobytes and blocking render, customers are staring at a blank header while it loads. Swap display mode and font subsetting (only loading the characters you actually use) fixes that in an afternoon.
Where Owner-Operators Should Actually Spend Their Time
Speed work has diminishing returns past a point, and chasing a perfect Lighthouse score on pages nobody converts on is wasted effort. My take: fix your homepage, your contact or booking page, and your top service pages first, because those are where speed actually affects revenue. A blog post loading half a second slower rarely costs you a lead.
Set a recurring check, monthly is plenty, using PageSpeed Insights, and treat a sudden score drop as a signal something new (a plugin, an ad script) got added. For a Toronto contractor, an actual visual example that works as a short clip: side-by-side screen recordings of a site loading in 5 seconds versus 1.5 seconds, timestamped on screen, is more convincing than any statistic.
— Cristo
Get Your Free Speed and SEO Audit From CloudSprout
Cloudsprout is the alternative to guessing which fix matters most: instead of piecing together tips from five different tools, you get one prioritized report telling you exactly what’s slowing your site down and what fixing it will cost in time. The Free SEO Audit runs your site through the same diagnostics covered in this guide, Core Web Vitals, TTFB, image weight, script bloat, and hands back a ranked list of fixes, not a wall of jargon.
Everything at Cloudsprout is built and fixed in-house, no outsourcing to a third-party dev shop, so the same team that runs your audit is the team implementing the caching, image, and hosting changes. If your current site was built years ago on a page builder loaded with plugins, a rebuild through Website Development often solves the speed problem at the root instead of patching around it. Book your free audit and get the prioritized list before you spend another dollar guessing.
Sources
PageSpeed Insights tests any URL free and shows both lab and real-user data. Core Web Vitals on web.dev explains each metric in Google’s own words. Cloudflare’s speed guide covers CDN and DNS basics. For a deeper look at how site speed connects to search visibility, see Cloudsprout’s technical SEO guide or this partner resource on understanding search algorithms.
- PageSpeed Insights documentation — About Core Web Vitals
- How to reduce TTFB — WP Rocket
- Web
- Tips to improve website speed — Cloudflare Learning
FAQ
How Can I Improve My Website’s Speed?
Run PageSpeed Insights to see your current scores, then prioritize server response time (TTFB under 200 milliseconds), image compression, and browser caching, since these three fixes typically deliver the largest gains for the least effort.
What Are the 7 C’s of a Website?
Definitions vary across sources, but this isn’t a formal industry standard the way Core Web Vitals are; if you’ve seen it referenced, treat it as informal marketing shorthand rather than a technical benchmark to optimize toward.
What Is a Good Website Speed Score?
A good LCP is under 2.5 seconds, according to Google’s Core Web Vitals thresholds, and a good TTFB is under 200 milliseconds.
What Is the 3 Second Rule in Website Design?
It’s the common rule of thumb that visitors start abandoning a page if it hasn’t loaded within about 3 seconds, which is why Google’s LCP threshold for “Good” sits at 2.5 seconds, just under that abandonment window.
Should I Fix Speed Myself or Hire an Agency?
If you’re comfortable running PageSpeed Insights and briefing a developer with a prioritized list, DIY quick wins like image compression and caching plugins can get you most of the way. If your site runs on outdated hosting or a plugin-heavy builder, a full audit through a service like Cloudsprout’s free SEO audit typically finds structural issues DIY fixes can’t reach.
Recommended
Less reading. More growing.
We build the systems these articles describe. Websites, AI follow-up, reviews, automation. And run them for you.
Keep reading

Protect Your Traffic: Website Migration Checklist for Small Businesses

