

Here is a quick test. Open your marketing reports and try to answer one question in five seconds: “Did marketing bring me more paying customers this month, and what did each one cost?” If you can’t, you probably have charts but no dashboard. A marketing dashboard is one screen that shows the few numbers tied to leads, customers and money. For most owner-operated businesses in Ontario, that means about seven metrics, a few formulas and a 30-minute monthly review. We build and review this kind of reporting for small businesses, and it is part of our Analytics & Reporting service.
TL;DR
- Track seven things: spend, website visitors, leads, conversion rate, cost per lead, cost per new customer and revenue from marketing.
- Every number on the screen should lead to a decision. If nobody would act on it, remove it.
- Count leads once. Phone calls, forms and ad platform reports often overlap, so pick one source of truth for each number.
- Check ad spend and leads weekly. Check customers and costs monthly. Check return on investment quarterly.
- A simple one-page layout beats a 27-chart report you never open.
Table of Contents
- What is a marketing dashboard, in plain words?
- Why isn’t my marketing showing me results?
- The seven marketing dashboard metrics a small business needs
- What should a good marketing dashboard look like?
- How do I keep the numbers honest?
- How often should I check each number?
- What metrics should I skip?
- A dashboard, in our view
- Want us to look at your numbers?
- FAQ
- Sources
What is a marketing dashboard, in plain words?
Think of the dashboard in your truck. It doesn’t show every sensor in the engine. It shows speed, fuel and warning lights, because those are what you act on while driving.
A marketing dashboard does the same job. It pulls numbers from your website, your ads, your phone line and your customer list onto one page. The Business Development Bank of Canada (BDC) describes marketing KPIs, or key performance indicators, as metrics that measure how well your business objectives are playing out. So the question to ask first isn’t “what can I measure?” It’s “what am I trying to get?”
For most small businesses the goal is simple: more calls, bookings or orders from people who would pay, at a cost that leaves a profit.
Why isn’t my marketing showing me results?
Usually it’s one of three problems.
- You are looking at vanity numbers. Followers, impressions and page views feel good. They don’t tell you whether the phone rang.
- You can see volume but not cost. Fifty leads sounds great until you learn they cost $4,000 in ads.
- The numbers live in five places. Google, Facebook, your website form, your call log and your invoicing software each tell a slightly different story.
A good dashboard fixes all three by choosing a few numbers that connect marketing to money, and by agreeing on where each number comes from.
The seven marketing dashboard metrics a small business needs
BDC groups marketing KPIs into categories including financial performance, lead generation, SEO and content, and paid ads. You don’t need all of them. Pick one or two per stage of the customer path: someone finds you, visits, contacts you, becomes a customer.
1. Marketing spend
Add up what you paid for ads, tools and anyone who helps with marketing. Without this number, nothing else on the page can tell you whether marketing pays off.
2. Website visitors, by source
This shows how many people arrived and where they came from: Google search, Google Maps, social media, email or direct visits. It is the top of the funnel, and it matters most when you compare it to the numbers below. Ten thousand visitors and no calls is a message problem, not a traffic problem.
3. Leads
A lead is anyone who raised a hand: a form submission, a phone call, a chat or a booked quote. For local service businesses, calls are often the biggest source and the one most often missed. A tracking number on your website lets you see which marketing produced which call. A call tracking and analytics platform is one way larger operations centralize call data so the same lead isn’t counted twice.
4. Conversion rate
This is the share of visitors who take the action you want. A BC open textbook on digital marketing gives the formula as visitors who converted divided by total visitors, times 100.
Example (hypothetical): 800 visitors and 24 quote requests gives 24 ÷ 800 × 100 = 3%.
If this number is low, your website is usually the place to look, not your ad budget. That is the problem behind the question “why isn’t my website getting leads?”
5. Cost per lead (CPL)
Divide what you spent on a channel by the leads it produced. BDC lists cost per lead in its lead generation category. Compare channels side by side: Google Ads might cost $60 a lead and your Google Business Profile might cost nothing but time.
For paid ads, BDC also defines the building blocks: cost per click is ad cost divided by clicks, click-through rate is clicks divided by impressions, and return on ad spend is ad revenue divided by ad cost.
6. Customer acquisition cost (CAC)
This is the cost of winning one new paying customer. Shopify Canada defines it as total advertising spend divided by new customers gained in a period, with a worked example of $1,000 in spend and 200 new customers giving a $5 CAC.
For a service business, count every new customer, not just leads. A lead that never books doesn’t count.
The key comparison is CAC against what a customer is worth over time. If a new HVAC customer spends $400 over three years and costs you $450 to win, that channel loses money.
7. Revenue from marketing, and return on investment
This is the number your accountant cares about. BDC’s formula for return on marketing investment is sales revenue from marketing minus marketing costs, divided by marketing costs. The BC textbook uses the same logic: revenues minus the expenses related to those revenues, divided by those expenses.
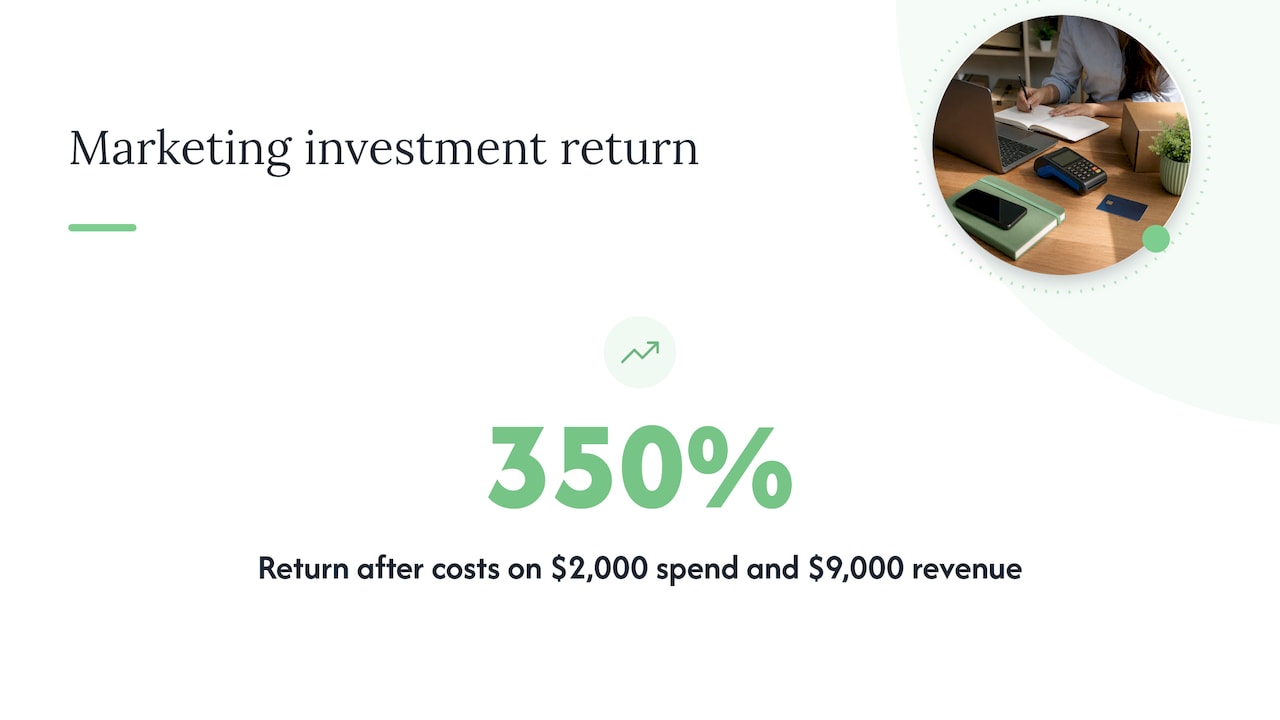
Example (hypothetical): you spend $2,000 in a month and the jobs that came from marketing brought in $9,000. Your return is (9,000 − 2,000) ÷ 2,000 = 3.5, or 350%.
A quick caution: return on ad spend and return on investment are not the same thing. Return on ad spend uses revenue. Investment return should be measured after costs.
What should a good marketing dashboard look like?
You may see people searching for “marketing dashboard examples.” Most fancy ones are built for large marketing teams. A small business needs a page you can read standing in a driveway.
Here is a layout that works for an owner-operator:
| Row | What goes there | Why it’s there |
|---|---|---|
| Top | Four big tiles: leads, new customers, cost per new customer, revenue from marketing, each compared with last month | The answer in five seconds |
| Middle | One line chart of leads by week, split by source | Shows which channels are growing |
| Lower middle | A small table by channel: spend, leads, cost per lead, customers | Shows where money works and where it leaks |
| Bottom | Website conversion rate and top pages that produce leads | Shows what to fix on your site |
That is the whole thing. Headline numbers go at the top, channel detail below and website performance last. If a tile doesn’t help you make a decision, delete it.
A quick example for an Ontario plumber
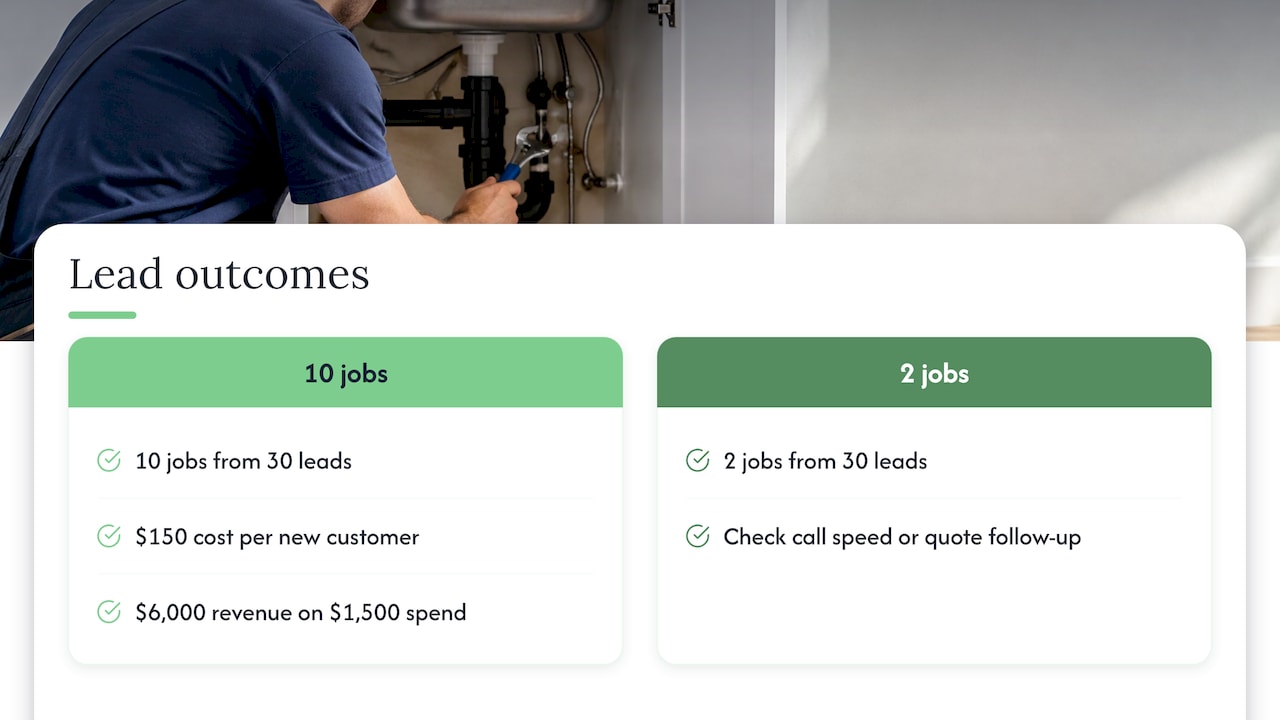
This is a made-up example to show the thinking. Say a plumbing company in Hamilton spends $1,500 a month on Google Ads and gets 30 calls and forms. That is $50 a lead. Ten of them become jobs, so the cost per new customer is $150. Those jobs average $600 each.
The tile at the top shows $6,000 in revenue from marketing, against $1,500 in spend. That is a good month, and the owner can decide to add budget. Now say the same dashboard showed 30 leads but only 2 jobs. The problem would be speed to answer calls or quote follow-up, not ads. One page, two very different decisions.
How do I keep the numbers honest?
This is where most small-business dashboards go wrong. The charts look fine, but the numbers were combined badly.
- Count each lead once. Your ad platform and your website analytics each count conversions their own way. Adding them together double-counts. Choose one source for each tile and stick to it.
- Use your customer records as the final word. Your CRM, booking system or invoices are the source of truth for customers and revenue. Ad platforms can report conversions that never turned into paying customers.
- Recalculate rates from totals. Don’t average daily rates. Work out click-through rate from total clicks and total impressions for the period.
- Tag your links. Add campaign tags (UTM parameters) to links in ads, emails and social posts so Google Analytics knows where visitors came from.
- Write the formula down. For each tile, note the formula, where the data comes from and the date range. In six months you will not remember.
If your website forms don’t feed a customer list yet, that is the first thing to connect. Our guide to connecting your website to a CRM walks through it, and automating lead routing makes sure every lead lands with a person fast.
How often should I check each number?
Not everything moves at the same speed. Match the check to the speed.
| How often | What to look at | Why |
|---|---|---|
| Weekly (5 minutes) | Ad spend, leads, missed calls | Paid campaigns can waste money fast |
| Monthly (30 minutes) | New customers, CAC, conversion rate, cost per lead | Enough data to see a real trend |
| Quarterly | Return on investment, customer lifetime value, repeat customers | These move slowly |
At the monthly review, compare each number with last month and with your target, then choose two or three actions at most. For example: pause the worst-performing ad group, rewrite the contact page headline, call back every unanswered lead within an hour. Fewer actions get done. A long list doesn’t.
What metrics should I skip?
You don’t have to ban them, but keep these off the main screen unless they tie to a decision:
- Followers and likes
- Raw page views
- Impressions on their own
- Time on site
They can help you diagnose a problem, but they rarely show whether marketing is working. BDC puts social media and brand awareness in separate categories from financial performance for a reason: they are supporting numbers, not the scoreboard.
Online stores have a few extra numbers worth adding: cart abandonment, checkout completion and repeat purchase rate. The same rule applies. Add one only if you would act on it.
A dashboard, in our view
Most small business owners tell us some version of the same thing: “I’m spending money on marketing and I can’t tell if it works.” The fix usually isn’t more software. It’s fewer numbers, set up properly.
We think a dashboard is only as good as the plumbing behind it. If your website, your phone line and your CRM don’t talk to each other, the dashboard will argue with itself. So we start at the source: clean tracking, one record per lead, and one place where customers and revenue are kept.
We do everything in-house, so the people who build your website, run your search and ads, and set up your reporting are the same team. That matters for dashboards because a number only means something if the person reading it knows how it was collected. You also get direct access to the people doing the work, so you can ask why a number moved and get a real answer.
Our approach is to pick the seven or so numbers that match your goal, set them up once, and review them with you in plain language. No jargon, no 40-page report, and no lock-in contract.
Cristo
Want us to look at your numbers?
If your reports don’t answer “what did each new customer cost me,” we can help. We start with a free trial that includes a full digital audit of your website, search presence and tracking. You see what is working and what isn’t before you commit to anything. Read more about the digital audit.
Our monthly plans run month to month, with no lock-in: Sprout is $300 a month, Grow is $600 a month and Scale is $1,200 a month, each with a one-time setup fee that depends on the plan. Ad management is priced separately. See the details on the pricing page.
FAQ
What are the most important marketing dashboard metrics for a small business?
Start with spend, leads, conversion rate, cost per lead, cost per new customer and revenue from marketing. These connect what you spend to the customers you win. Add website visitors by source if you want to see where people come from.
What is a good conversion rate for a website?
It depends on your trade, offer and traffic source, so it’s better to compare against your own past months. The formula is converting visitors divided by total visitors, times 100. Track it monthly and look for improvement after each website change.
Do I need special software to build a marketing dashboard?
Not to start. Many small businesses begin with their website analytics, ad accounts and customer list in one clear view. What matters more is clean tracking and agreeing on where each number comes from. Our Analytics & Reporting service handles that setup for you.
What’s the difference between ROAS and ROI?
Return on ad spend divides ad revenue by ad cost. Return on investment subtracts costs from revenue before dividing by costs, so it reflects profit. Use return on ad spend to compare ads quickly and return on investment to judge whether marketing is paying off.
How often should I review my dashboard?
Check ad spend and leads weekly, customers and costs monthly, and return on investment quarterly. A monthly 30-minute review with two or three actions is enough for most owner-operated businesses.
Sources
- BDC: How to use marketing key performance indicators
- Digital Marketing Analytics and Calculations, BCcampus open textbook
- Shopify Canada: Essential Marketing Metrics