

You pay for traffic, people land on your store, and most leave without buying. Ecommerce conversion optimization is the work of finding out why and fixing it, one step at a time, so more of the visitors you already have turn into orders. For most small stores the biggest wins sit in three places: the checkout, the product page, and how the site feels on a phone.
Here is the hook worth remembering. Take a Canadian store with 10,000 visitors a month, a 1.9% conversion rate and a $99.25 average order. That is about 190 orders and $18,857 in sales. Lift the rate to 2.4% with no extra ad spend and you get 240 orders and $23,820. Those figures are simple arithmetic on the national averages quoted below, not a promise for your store. The point is that a half-point change is worth thousands of dollars a month.
TL;DR
- Conversion rate is orders divided by visits, times 100. Work it out for your own store first, split by phone and desktop.
- Most carts are abandoned for fixable reasons: surprise costs, forced account creation, a long checkout and a lack of trust.
- Canadian shoppers are mostly on phones, so speed, big buttons and wallet payments such as Apple Pay and Google Pay matter.
- Change one thing at a time, give it enough traffic and time, and compare against your own past numbers, not a global average.
- Fix the checkout first, then product pages, then everything else.
Table of Contents
- What conversion rate means and how to calculate yours
- What is a good conversion rate for a Canadian store?
- How do I find out why visitors aren’t buying?
- Why do shoppers abandon their carts?
- Fix the checkout first
- Make your product pages do the selling
- Fix the phone experience
- How do I test changes without guessing?
- Where to start this week
- Our perspective
- How we can help
- FAQ
- Sources
What conversion rate means and how to calculate yours
A conversion is a visitor doing the thing you want. For a store, that is usually a purchase. BDC explains the maths: divide the number of completed actions by total visitors. Its example is a site with 100,000 visitors in three months and 1,000 purchases, which gives 1%.
So the steps are:
- Pick a period, such as the last 30 or 90 days.
- Count orders in that period.
- Count visits (or sessions) in the same period from your analytics.
- Divide orders by visits and multiply by 100.
Stripe gives the same method: 50 orders from 1,000 visitors is 5%. It also stresses that optimization is an ongoing practice, not a one-time fix. That matches what we see: stores that improve keep making small adjustments, and stores that stall treat a redesign as the finish line.
Calculate the rate separately for mobile and desktop, and for each traffic source if you can. A blended number hides the problem. A store with a decent desktop rate and a weak mobile rate looks “average” overall while losing most of its shoppers.
What is a good conversion rate for a Canadian store?
The honest answer: it depends on what you sell, and national numbers are only a rough guide.
Salesforce data for Q1 2025, reported by Retail Insider, put Canadian online retail conversion at 1.9%, down from 2.3% the quarter before. Average order value was $99.25. Mobile drove 70% of online traffic and 66% of online orders in Canada.
The same report shows abandonment is worse on phones: 88% on mobile against 80% on desktop. That is the gap you are trying to close.
A few ways to read benchmarks without fooling yourself:
- Compare within your category. A store selling gifts and a store selling jewellery do not share a target.
- Compare by device. Your mobile rate should be judged against mobile norms.
- Compare against yourself. The most useful benchmark is last quarter’s number for the same traffic mix.
- Be careful with US data. Many studies are American. They are useful for behaviour patterns, but your Canadian shoppers face duties, CAD pricing and different delivery costs.
How do I find out why visitors aren’t buying?
Before you change anything, find where people drop off. You do not need expensive software to start.
Walk the funnel with your own eyes
Buy something from your own store on your phone, on mobile data, not Wi-Fi. Note every moment you hesitate. Is the “add to cart” button visible without scrolling? Do shipping costs appear before the last step? Does it ask you to create an account? Does the postal code field accept a Canadian format?
Then ask someone who has never seen your store to do the same while you watch quietly. Two or three people will usually point to the same snag.
Check your analytics for the leak
In your analytics tool, look at how many visitors reach each step: product page, cart, checkout start, payment, confirmation. The step with the biggest fall is where to start. If very few people add to cart, the problem is the product page or the traffic quality. If many add to cart but few start checkout, look at shipping costs and cart design. If many start checkout but few finish, it is the checkout form, payment options or trust.

Watch real sessions
Free or low-cost session recordings and heatmaps show where people tap, stall and give up. Watch 20 or 30 mobile sessions from people who reached the cart and left. Patterns appear quickly: a button that looks tappable but isn’t, a popup covering the “continue” button, a form that jumps around when the keyboard opens.
Ask the people who left
A one-question exit survey on the cart page (“What stopped you from buying today?”) often gives you a wording you would never have guessed. Customer emails and chat questions are also free research. If five people ask “does this ship to Manitoba?”, that answer belongs on the product page.
Why do shoppers abandon their carts?
The most useful research here comes from the Baymard Institute, which has studied checkout behaviour for years. Its page collecting 50 studies puts the average documented cart abandonment rate at 70.22%. So seven in ten carts are never completed, which is normal and not a sign that your store is broken. The question is how many of those you can win back.
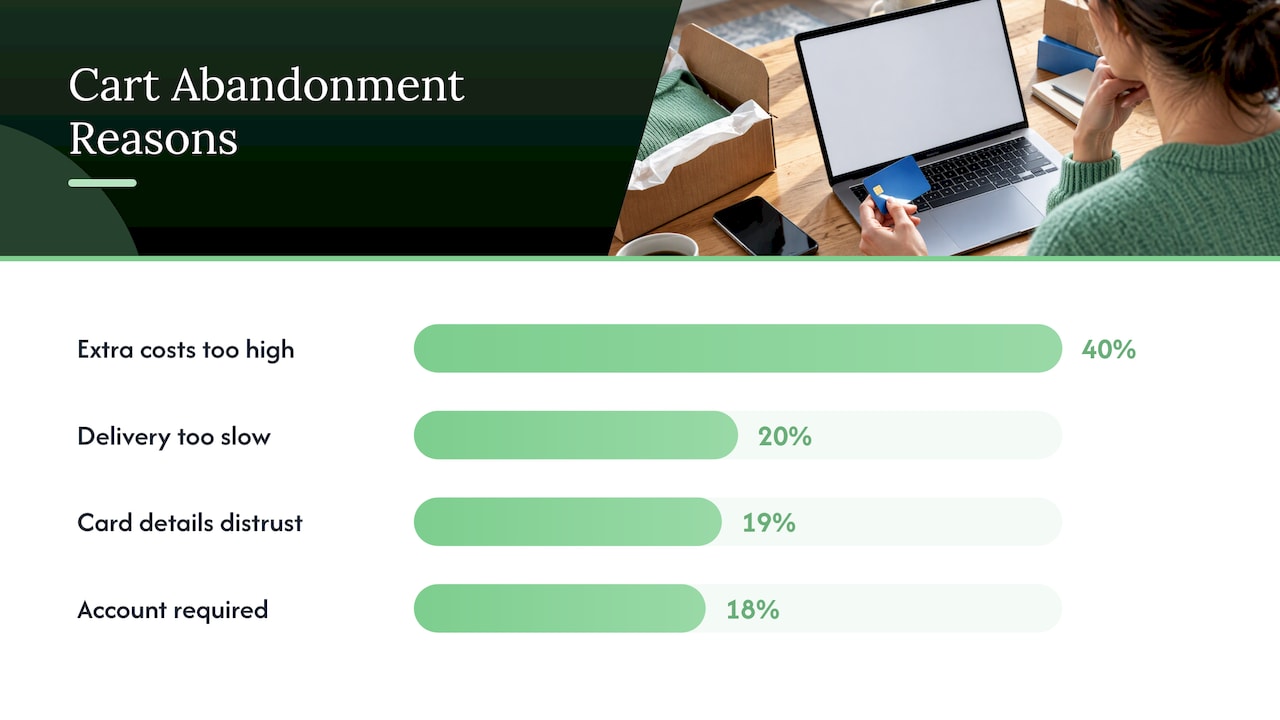
Excluding people who were only browsing, the same Baymard data on US shoppers who abandoned a cart gives these reasons:
| Reason for abandoning | Share of shoppers |
|---|---|
| Extra costs (shipping, tax, fees) too high | 40% |
| Delivery too slow | 20% |
| Didn’t trust the site with card details | 19% |
| Site wanted them to create an account | 18% |
These are American figures, so treat them as a pattern, not a Canadian measurement. They are still consistent with an academic review in Electronic Markets, which found that perceived cost and perceived risk, along with website factors such as inconvenient transactions and poor navigation or information design, all drive abandonment.
The takeaway is encouraging. Most of these reasons are things you control: when you show costs, whether you force an account, how clear your delivery promise is, and whether the page looks safe.
Fix the checkout first
The checkout is where interested shoppers become buyers or leave, so it earns your first hour.
Show the full cost early
Surprise costs are the top reason for abandonment in the Baymard data. Put shipping estimates on the product page or cart. If you ship across the border or use a courier that collects duties, say plainly what the customer will pay. Show prices in Canadian dollars and label the currency so nobody wonders.
Let people buy as guests
The academic review above notes that offering guest checkout or social login helps with abandonment. Baymard’s data shows 18% of abandoners left because they were asked to create an account. Offer account creation after the order, on the confirmation page.
Cut the form down
Baymard’s checkout research, based on testing and benchmarking of more than 850 checkout steps, found the average US checkout shows 23.48 form elements by default, while an ideal flow can get by with as few as 12. Stripe’s Canadian guide reports average checkouts with 11.3 form fields in 2024, where most purchases can be completed with 8.
A quick audit: for every field, ask whether you truly need it to ship the order. Phone number, company name and a second address line are common candidates to hide or make optional. Use a single full-name field if your system allows it, and fill in city and province from the postal code where you can.
Offer the payment methods Canadians already use
Wallets such as Apple Pay and Google Pay let a phone shopper pay with a thumbprint instead of typing 16 digits. Support Interac Debit and saved cards if your payment provider allows it. Your payment provider’s settings page will tell you which options you can switch on.
Build trust where the card details go
Nearly one in five abandoners in the Baymard data did not trust the site with card information. Keep the checkout looking like the rest of your store, show recognizable payment logos, and put your return policy, contact details and a real business address within reach. A small store with a clear “how to reach us” line feels safer than one with a polished design and no name behind it.
Baymard estimates that the average large ecommerce site could gain 35.26% in conversion rate through checkout design improvements. That is a research estimate for large sites, not a guarantee, but it shows why checkout work often pays back faster than a new homepage.
Make your product pages do the selling
A shopper who can’t picture the product, the size, the delivery date or the return process will leave and look elsewhere. For each product page, run through this list:
- Photos that answer questions. Show the product in use, at scale (next to a hand or a door frame), and from more than one angle.
- A plain description. Say what it is, who it suits and what is included before any marketing language.
- Price, shipping and delivery time near the buy button. Do not make people hunt.
- Real reviews and questions. Even five honest reviews help. Do not invent them.
- A returns line. One sentence in plain words.
- One clear button. “Add to cart” should stand out from everything else.
Product pages also need to be found in the first place. If you run an online store and want to improve how your pages appear in search, our guides on what ecommerce SEO is and on hand-optimizing 20 to 50 product pages cover that side. Better pages convert more of the visitors search brings in.
Fix the phone experience
With roughly 70% of Canadian online traffic on phones, a store that is only comfortable on a laptop is leaving most of its audience behind.
Speed is the first thing to check. A study by Google and Deloitte, cited by Stripe, found that making a mobile site 0.1 seconds faster produced an 8.4% conversion lift for retail. The usual culprits for small stores are oversized images, too many apps or plugins, and heavy popups.
A simple mobile checklist:
- Compress and resize product images before uploading them.
- Remove apps and scripts you no longer use.
- Make buttons large enough for a thumb, with space between them.
- Use the right keyboard type for each field (numbers for phone, email layout for email).
- Keep the cart button visible while the shopper scrolls.
- Test on an older phone, not just the newest one.
Google’s free PageSpeed Insights tool will tell you how your pages score on speed and give a list of specific fixes.
How do I test changes without guessing?
This is where many small shops go wrong. They change five things at once, see sales go up or down, and learn nothing.
A simple routine that works for owner-operators:
- Write down your baseline. Conversion rate, mobile and desktop, for the last 30 to 90 days.
- Pick one change. For example, showing shipping costs on the product page.
- Write a prediction. “We expect fewer carts to be abandoned at the shipping step.”
- Run it long enough. At least a couple of full weeks, so weekends and paydays are included. Avoid running it during a big sale, which distorts everything.
- Compare like with like. Look at the same step and the same device over the same length of time.
- Keep or undo it, then write down the result. A short log of what you changed and when saves you from repeating mistakes.
If your store has a lot of traffic, a proper A/B test, where half of visitors see the old version and half see the new one, is the cleanest way to judge. With low traffic, the before-and-after method above is a reasonable compromise, as long as you change one thing at a time and keep seasonality in mind. Small differences on small numbers are mostly noise, so don’t celebrate or panic over a few orders.
Where to start this week
If you do nothing else, do these in order:
- Calculate your conversion rate for phone and desktop.
- Place a test order on your phone and write down every friction point.
- Show shipping and delivery information before checkout.
- Turn on guest checkout and wallet payments.
- Remove every checkout field you can.
- Compress your product images and recheck your speed.
That sequence costs little and tackles the most common causes in the research. If you also want help with the website itself, the cost side is covered in what an online store costs in Canada.
Our perspective
Most store owners come to us asking for more traffic. When we look at the store, the traffic is often fine. The leak is in the middle: a slow phone experience, a checkout that asks for too much, a product page that doesn’t answer the one question a buyer has.
That is why we build and improve websites, search visibility and analytics under one roof, with no outsourcing. The person who sets up your tracking is the person who talks to the person fixing your pages. Changes get made one at a time, measured, and kept or undone, instead of a big redesign that nobody can evaluate.
Our approach is simple: audit first, fix the biggest drop-off, then repeat. Owners get direct access to the team doing the work, and monthly pricing with no lock-in contract, so the work has to keep earning its place.
Cristo
How we can help
If you would rather have a team find the leaks for you, we start with a free trial that includes a full digital audit of your site, so you see where visitors are dropping off before you commit to anything. Our monthly plans are Sprout at $300 CAD per month, Grow at $600 CAD per month and Scale at $1,200 CAD per month, with one-off setup fees of $500 to $1,500 CAD, $1,500 to $3,500 CAD and $3,500 to $7,500 CAD respectively. You can see exactly what each includes on our pricing page.
If you want a new or rebuilt store, see our website development services, or get in touch through our site.
FAQ
What is a good ecommerce conversion rate in Canada?
Salesforce data reported for Q1 2025 put Canadian online retail conversion at 1.9%. Rates differ a lot by product type and device, so use that as a rough reference and track your own trend by category and by phone versus desktop.
How do I reduce cart abandonment?
Start with the causes shoppers cite most: show shipping and other costs early, allow guest checkout, shorten the form and make the page feel trustworthy. Then offer wallet payments such as Apple Pay and Google Pay so phone shoppers can pay quickly.
How long does it take to see results from conversion optimization?
Changes to checkout or product pages can show an effect within a few weeks if you have steady traffic. Give each change at least two full weeks and compare against the same period before. Treat it as an ongoing habit, not a single project.
Should I fix traffic or conversion first?
If visitors reach your cart and leave, more traffic just sends more people through the same leak. Check your funnel first. If almost nobody reaches the product pages, the problem is traffic or targeting, and search visibility is the better place to start.
Sources
- BDC: What is a conversion rate?
- Stripe: Ecommerce conversion rate optimization strategies
- Stripe Canada: Build a streamlined checkout process
- Retail Insider: Canadian online retail sales drop 3% in Q1 2025
- Baymard Institute: Cart abandonment rate statistics
- Baymard Institute: Checkout usability report and benchmark
- Electronic Markets: Electronic shopping cart abandonment review